Business Intelligence
& Data Visualization Services
Free BI Readiness Assessment
Identify your three biggest blind spots & how to fix them.
SCHEDULE AN ASSESSMENTYour Data Already Has the Answers. We Help You Find Them.
Most organizations aren’t suffering from a lack of data, they’re suffering from data that’s scattered, untrustworthy, and impossible to act on. Our business intelligence and data visualization services change that.
We bring your numbers together, make sense of them, and deliver the custom dashboards and enterprise analytics your team needs. Instead of chasing reports and second-guessing spreadsheets, your people spend their time on the decisions that actually move the business forward.
See Clearly.
Understand Deeply.
Act Decisively.
What sets our BI services apart
.01
Complete
Data Visibility
Every source, every system, one clear picture.
.02
Insights Every Leader
Can Act On
No data team required to understand it.
.03
One Version
of the Truth
Everyone working from the same reliable numbers.
.04
AI-Enhanced
& Real-Time
Your data thinks ahead so you can too.
.05
Fixed Cost.
Warranty-Backed.
Scoped, priced, and guaranteed before we start.
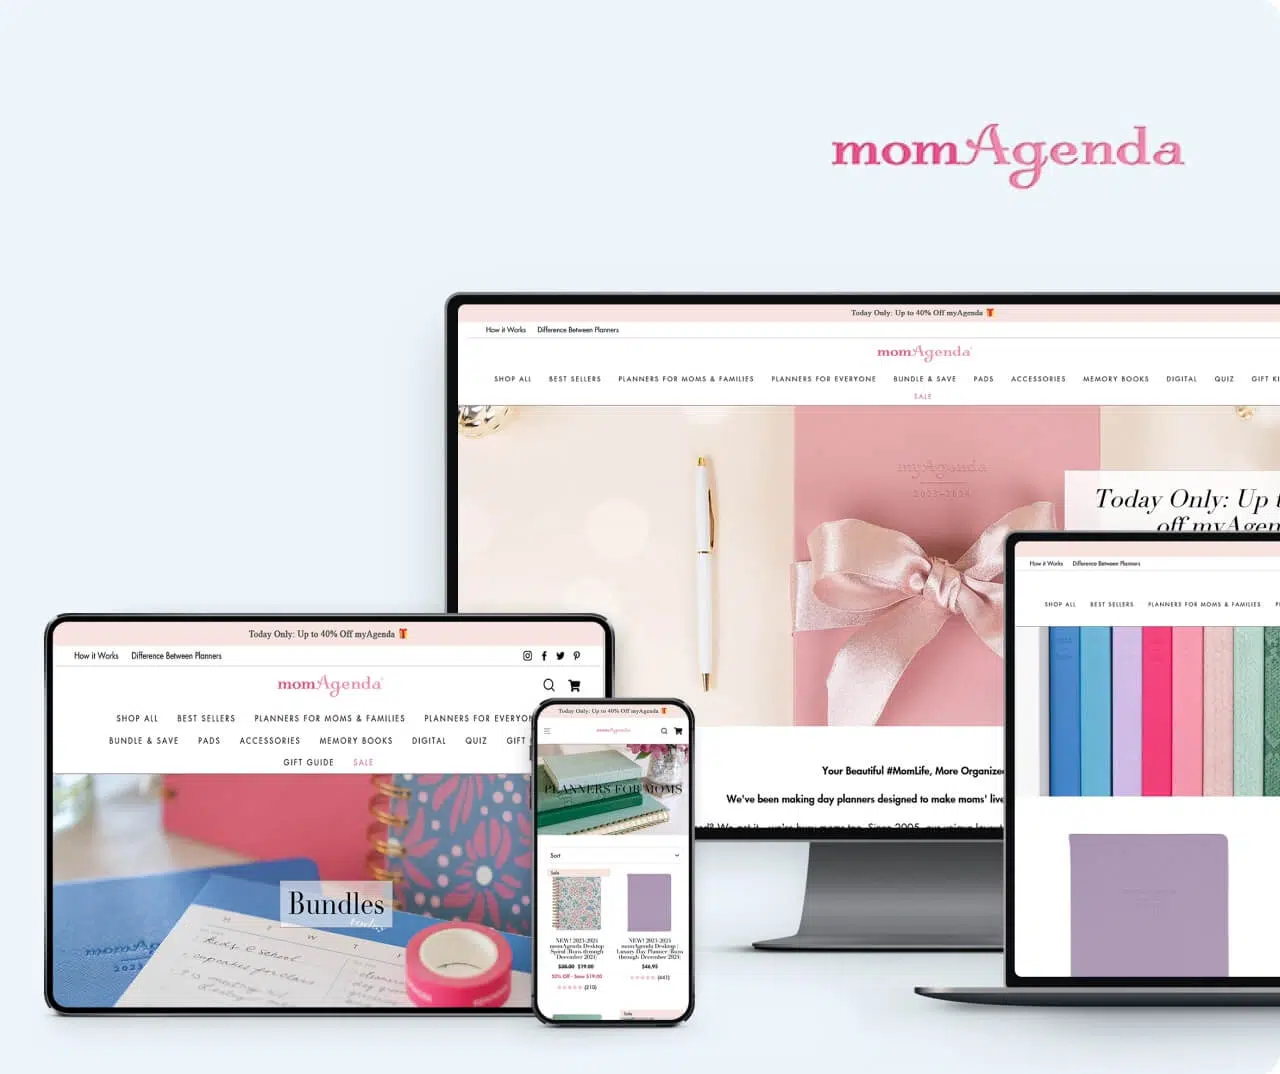
momAgenda®
Bringing Organizational Elegance to Families with a Planner-Centric Online Store
-
58%
more product views -
49%
fewer abandoned carts -
74%
mobile conversion rate -
66%
faster load times
OUR SERVICES
Business Intelligence & Data Visualization Services
End-to-end business intelligence and data visualization services. From data warehousing and ETL through custom data visualization, BI dashboard development, embedded analytics, and AI-enhanced forecasting.
60%
Faster Time to Insight
4-6 weeks
Avg Dashboard Deployment
100%
Fixed Cost Delivery
Unify Your Data
Unify your data before you can act on it.
BI Strategy &
Roadmapping
Stop guessing where to start. We map your data strategy from day one.
Data Warehousing
and ETL
Pull all your scattered data into one place everyone in the business trusts.
Data Integration
& Management
Connect your business systems so your data actually works together.
Data Quality
and Cleansing
Fix dirty, incomplete, and inconsistent data before it reaches your dashboards..

Visualize and Analyze
Dashboards and analytics your team will actually use.
BI Dashboard
Development
The right metrics, in front of the right people, the moment they need them.
KPI Framework
Design
Define the metrics that actually measure performance before the build begins.
Advanced
Analytics
Spot trends, catch problems early, and understand why your numbers move.
Self-Service
Analytics
Let your team answer their own data questions, no IT ticket required.
Embedded
Analytics
Give your users data insights inside your product without building it from scratch.
Forecast and Optimize
Scale your BI with AI, automation, and support.
AI-Enhanced
Forecasting
Know what’s coming … predict revenue, demand, and churn before they happen..
Real-Time Operations
Intelligence
Stop making decisions on stale data. Get live dashboards that update as your business moves.
BI Platform
Migration
Modernize your reporting without losing the logic and history your team depends on..
Managed BI
& Support
As your BI platform grows with your business we stay on as your long-term data partner.
Governance &
Compliance
Control who sees what with the compliance frameworks your industry requires.
Not Sure Where Your
Data Gaps Are?
Our Free BI Readiness Assessment identifies your three biggest data blind spots and maps a clear path to fixing them.
Customer Success Stories
SPC4® Digital Logger
Transforming Industrial Tension
Testing with Real-Time Digital Logging
-
80%
fewer discrepancies -
85%
faster confirmations -
90%
adoption -
50%
increased visibility

Loop News Web
Delivering Smart, Personalized Breaking News to Millions Across the Caribbean
-
30%
faster content management -
99%
uptime reliability -
3М+
active users reached -
67%
more user engagement

Every Industry Has a Data Problem. We Know Yours.
We’ve built BI solutions across industries with real regulatory, operational, and scale constraints … not just dashboards.
What Changes When Your Data Works
More visibility into what's actually happening



20+
What Happens When Your Data Partner Actually Delivers
By integrating our inventory, fulfillment, and CRM systems into a real-time dashboard, DCD automated hours of manual work saving us time, money, and customer frustration.
Miklos Bartha
Director of Operations, SilverVase Inc.
DCD really stood out with their transparency, accuracy, and consistency delivering excellent work on time and on budget, even through change requests.
Matt Drage
VP of Product Development, Salt River Materials Group
Business Intelligence & Data Visualization Services
How fast can we deploy BI dashboards?
Most BI dashboard engagements move from kickoff to first working dashboard in four to six weeks. We begin with a discovery sprint that maps your data sources, defines KPIs, and establishes your BI roadmap — so by the time we build, we're building the right thing.
Which BI platforms do you build on?
We're platform-agnostic and work across Power BI, Tableau, Looker, Qlik, and Looker Studio. If you already have a platform, we build on it. If you're starting fresh, we recommend the right fit for your data volume, team structure, and budget ... not the one we happen to prefer.
Are your BI engagements fixed-cost?
Yes — every engagement is scoped and priced before work begins. You'll know exactly what you're getting and what it costs. If scope changes, we document it and get your approval before it affects the budget. No surprise invoices.
Can you work with data from multiple systems (ERP, CRM, cloud)?
Yes. Data integration across fragmented systems is central to what we do. We build ETL pipelines and data warehousing solutions that unify ERP, CRM, IoT, cloud, and third-party data into a single governed source of truth your dashboards can reliably draw from.
What's the difference between BI and standard reporting?
Standard reporting tells you what happened. Business intelligence and data visualization services tell you why it happened, what's likely to happen next, and where to focus. BI platforms surface patterns, anomalies, and trends that static reports can't in real time, not at month end.
Do you offer a warranty on BI work?
Yes. All DCD deliverables are warranty-backed. If something we built doesn't perform as specified, we fix it. That applies to dashboards, ETL pipelines, data integrations, and every other component of your BI platform.
See What Your Data’s Been Trying to Tell You.
- Free BI consultation with roadmap + insights benchmark
- Transparent cost estimates and delivery timelines
- One team for strategy, ETL, dashboards, and AI
Start your BI journey today.
By clicking Submit, you consent to Dot Com Development processing your personal data per our Privacy Policy to provide you with relevant information.
Need Help Right Away?
We’re easy to reach. Book a video call, call us, or stop by in person.